
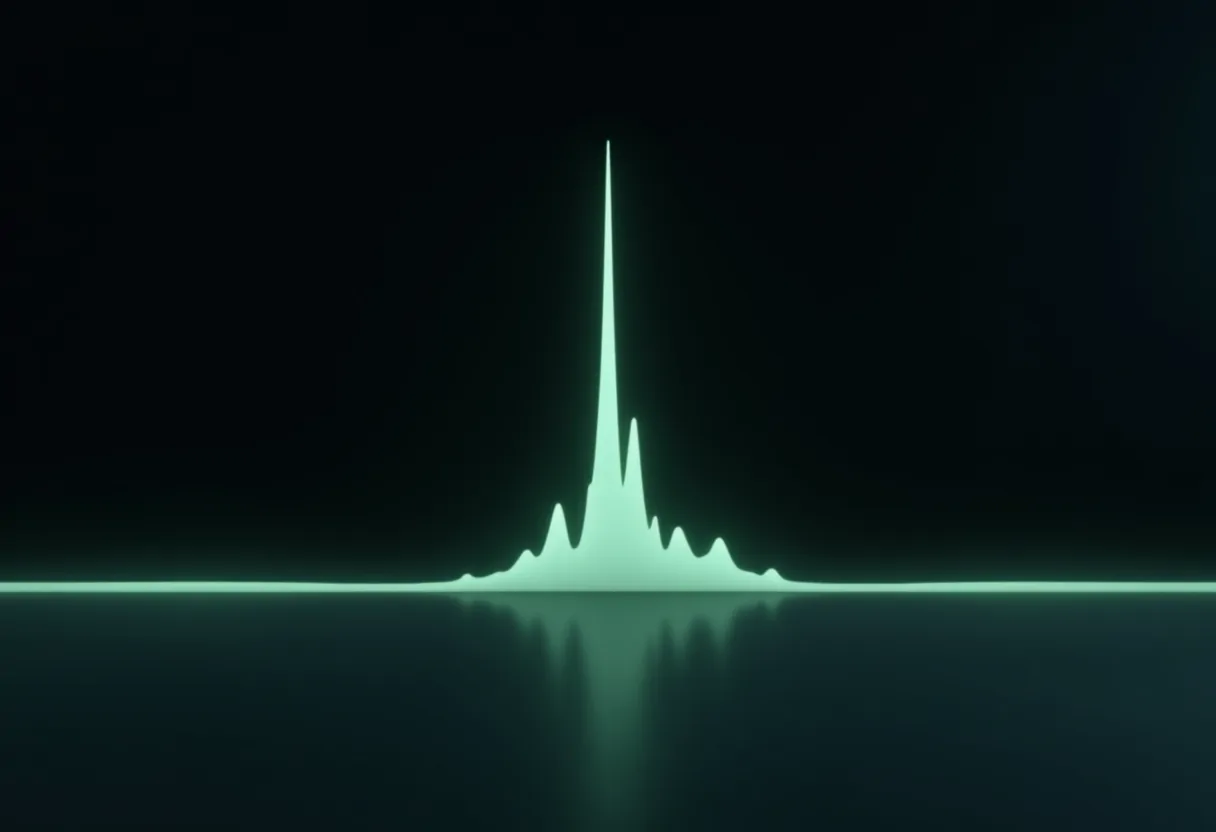
A purity figure on a certificate of analysis is the percentage of total detector response attributable to the main peak in a chromatogram. It is an area measurement, not a mass measurement, and it describes only what the method could separate and the detector could see. Two lots can both carry a 99% figure and differ materially in what is in the vial.
That is not a reason to distrust the number. It is a reason to read it alongside the method that produced it.
How reversed-phase HPLC separates a peptide
Reversed-phase high-performance liquid chromatography pushes a dissolved sample through a column packed with a non-polar stationary phase, most often silica with C18 alkyl chains bonded to it. The mobile phase starts water-rich and becomes progressively richer in an organic solvent, usually acetonitrile, across the run. Both phases typically carry a small amount of an ion-pairing acid, commonly 0.1% trifluoroacetic acid.
Molecules partition between the two phases according to hydrophobicity. The more water-loving a species is, the sooner it leaves the column. The main peptide and its related impurities exit at different points in that gradient, and a detector downstream records each one as a peak.
Why the detector wavelength matters
Most peptide methods detect in the ultraviolet at one of two wavelengths, and the choice changes what the number means.
- 214 nm reads the peptide bond itself, so every peptide species in the sample responds, including fragments and deletion sequences. This is the more complete view and the more common choice for a purity assay.
- 280 nm reads aromatic side chains, principally tryptophan and tyrosine. It is useful for quantifying a peptide that contains them, but a related impurity lacking those residues is close to invisible at this wavelength.
A 99% figure at 280 nm on a peptide with a single tyrosine is a weaker statement than the same figure at 214 nm. The certificate should say which was used.
What the method separates well
Reversed-phase separation is good at resolving species whose hydrophobicity differs from the target. In practice that covers most of what goes wrong in synthesis and storage:
- Truncated and deletion sequences, where one or more residues failed to couple during assembly.
- Oxidised species, particularly at methionine and tryptophan, which usually elute earlier than the parent.
- Incompletely deprotected material still carrying a side-chain protecting group, which is markedly more hydrophobic and elutes late.
- Hydrolysis and deamidation products formed on storage, which commonly appear as a shoulder or a small satellite peak near the main one.
What the number cannot tell you
Four categories of content are routinely absent from a purity percentage, and all four are present in real vials.
- Water. Lyophilised material is hygroscopic and holds residual moisture. Water does not absorb in the ultraviolet and contributes no peak.
- Counterions. Peptides purified with trifluoroacetic acid are usually isolated as TFA salts, and that counterion can be a substantial fraction of the vial mass. It is not a chromatographic peak either.
- Inorganic salts and other non-chromophores carried through from purification.
- Anything that co-elutes with the main peak. A species that happens to share the target's retention time is counted inside the main peak area and inflates the figure.
The first three are the reason a separate net peptide content determination exists, and why a 10 mg label does not mean 10 mg of peptide. The fourth is the reason a chromatogram is worth more than a number.
Reading the trace rather than the figure
When a chromatogram accompanies the certificate, a few features carry most of the information.
- Baseline. A flat, quiet baseline either side of the main peak indicates a clean separation. A drifting or noisy baseline makes integration arbitrary.
- Peak shape. A symmetrical peak suggests a single well-behaved species. Fronting or tailing can indicate column overload, a secondary interaction, or two species not quite resolved.
- Shoulders. A bulge on the leading or trailing edge is usually a closely related impurity that the gradient did not fully separate. It is often integrated into the main peak.
- Run length. A gradient that ends shortly after the main peak elutes cannot report late-eluting hydrophobic impurities, because they never came off the column during the run.
Area percent is not mass percent
Area percent assumes every species responds to the detector in proportion to its quantity, and that assumption rarely holds exactly. A fragment with fewer peptide bonds absorbs less at 214 nm per unit mass than the parent, so its area understates its share. The convention is accepted and useful, but it is a convention.
This is why a purity assay is one line on a certificate rather than the whole of it. Identity by mass spectrometry, net peptide content, endotoxin and sterility each answer a question that chromatographic purity does not.
What to ask a supplier
- At what wavelength was purity determined, and over what gradient and run time?
- Is the chromatogram itself available for the specific lot, not a representative example?
- Is net peptide content reported separately, and by what method?
- Was the analysis performed in-house, by an independent laboratory, or both?
A supplier that can answer those four without hesitation is describing a real method. One that can only restate the percentage is describing a label.
This sits inside the wider picture of what gets tested and why, which why peptide testing matters sets out across the whole analytical panel.